Measuring Income Distribution
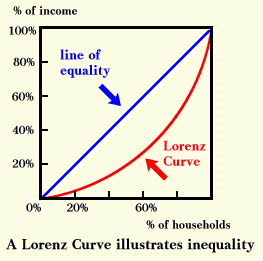
It is possible to measure how equally or unequally a price system rations by looking at the distribution of income. The table below shows that during 1978, 20% of households in the United States (groups of people living together, usually families, or single people if they live alone) had total money incomes of less than $6,391. These people received only 4.3% of the total income that households earned. Twenty percent of households earned between $6,391 and $11,955, and these households earned 10.3% of the total income earned. The rest of the table can be interpreted in the same way.
|
|
|
|
|
|
(under $6391) |
|
|
($6392 - $11955) |
|
|
($11956 - $18122) |
|
|
($18122 - $26334) |
|
|
($26335 and over) |
|
|
Source: U.S. Bureau of Census, Current Population Reports, P-60, No. 121, "Money Income in 1978 of Households in the United States," Washington, D.C.: U.S. Government Printing Office, 1980. Data taken from cover. (Data are before taxes.) |
|
The information in the table can be made into a Lorenz curve such as that shown below. The further the Lorenz curve lies below the line of equality, the more unequal is the distribution of income.

All economic statistics have problems, and the Lorenz curve and the numbers from which it is constructed are no exceptions. Problems come from two sources: do the numbers actually measure what they are supposed to measure, and are the numbers accurate?
Recall that price rationing discriminates in favor of some by giving them large amounts of goods and services and against others to whom it gives very little. Income distribution statistics are designed to tell us how much of this kind of discrimination exists in a system of price rationing. However, differences in the ability to use income wisely also affect the amount discrimination. If those who receive the most income, for example, also tend to be the most capable at using that income, then the picture that the Lorenz curve shows will understate the actual amount of inequality.
In the United States most rationing is done with price, but not all. For example, the purpose of public housing and food stamps is to prevent rationing by price. Both of these items are ignored in the data in the table. If rationing is not done primarily by price but by other methods, then looking at income data may be meaningless. One should be cautious when comparing income distributions among countries because their rationing systems can be very different. For example, comparisons of income distribution between the United States and the Soviet Union were not meaningful—although economists sometimes made them—because the Soviet Union not only relied heavily on queuing, but those with special status, such as party members, had access to stores denied to the ordinary citizen.
Households differ in size and average age, but these differences are not reflected in the table above. Neither is the fact that the amount of time over which income is earned affects the shape of the Lorenz curve. Larger households tend to earn more than smaller households. People in their thirties tend to earn more than people in their twenties. Households with four or five members, with more than one person working, and whose working members are between 35 and 55 tend to earn more than other households. In a paper published in the American Economic Review in September of 1975, Morton Paglin concluded that ignoring the influence of age on earnings overstates inequality by 50%. There is also variability from year to year in how much households earn. Some people appear poor because they had an unusually bad year, and others will seem rich because they had an unusually good year. The shorter the period over which income is measured, the more unequal the distribution appears. Thus, if income were measured over a decade, the distribution would be more equal than any of the yearly distributions.
The other source of problems is in making the initial measurements. The data shown in the table were obtained from questionnaires given a sample of 56,000 households. Not all of these households gave correct answers. The publication containing these data had a lengthy discussion of measurement problems, but when other people use these data in a book or an article or an argument, that lengthy discussion often gets left out (as it does here).1
Despite the measuring problems, it is clear that a system of price rationing will distribute goods less equally than will alternative systems such as those using queuing or coupons. Many people consider this inequality a major shortcoming of a market economy, and most critics of market systems emphasize this characteristic. Many of these critics believe that the government should try to promote fairness by redistributing income.
1Sizeable measurement problems are not unusual in economics statistics. There are substantial measurement problems in the popular economics statistics, such as the unemployment rate, the rate of inflation, and the Gross Domestic Product.
Copyright Robert Schenk