![]()
Cycles Recycled
Most economists abandoned the business-cycle framework after the introduction of the income-expenditure model in the 1930s. The income-expenditure model encouraged economists to developed models that stressed equilibrium, and this stress on equilibrium dominated macroeconomics during the 1950s and 1960s. Only in the 1970s did problems of the adjustment process return to center stage. Once economists started to worry again about adjustment, cycles reappeared because many assumptions yield cyclical adjustment patterns.
Supply and demand models, either of individual markets or aggregated, can help us see issues of adjustment. When there is a surplus in a supply and demand model, we expect pressure to decrease price. The larger the surplus, the greater that pressure should be. A shortage, on the other hand, will produce pressure to increase price. We will call the size of the surplus or shortage the output gap, and we will measure it in percentage terms.
If price is totally flexible, adjustment should be instantaneous, and the size of the output gap would not matter. Price adjustment, however, often takes time. The adjustment time depends partly on how sticky prices are, and partly on how big the output gap is. Therefore new price will be the old price plus an adjustment factor. The adjustment factor depends on how sticky prices are and the size of the output gap.
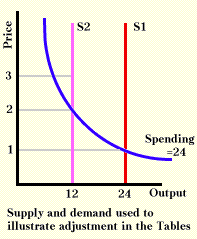
The supply and demand curves illustrated below have special properties to simplify calculations. The supply curve is vertical and the demand curve is a rectangular hyperbola. This demand curve gives people a fixed amount of spending. Because people spend a fixed amount of $24, they will buy 12 if the price is $2, but only 8 if the price is $3. With supply curve S2 and a price of $3, there will be a surplus of 4 (because 12 are produced and people only want 8). This surplus is 33.3% of the equilibrium output.
The table below shows some results that these curves and our adjustment process give for different levels of price stickiness. In each case we begin with an equilibrium of output at 24 and price at 1, and then shift the supply curve so the new equilibrium output is 12. When prices are very sticky, a big output gap makes price move only a little, so we approach equilibrium very slowly. In contrast, when prices are slippery, then small output gaps produce very large price movements, and the model will overadjust and generate cycles around the equilibrium output.
|
|
||||||
|
|
a = 0.2 |
a = 0.8 |
a = 1.1 |
|||
|
|
|
|
|
|
|
|
|
|
|
|
|
|
|
|
|
|
|
|
|
|
|
|
|
|
|
|
|
|
|
|
|
|
|
|
|
|
|
|
|
|
|
|
|
|
|
|
|
|
||||||
|
|
|
|
|
|
|
|
|
|
|
|
|
|
|
|
|
Columns generated with equations: Output gap = (output last year - equilibrium output)/equilibrium output; |
||||||
Why should prices be sticky? Production lags are one reason. Producers may need time to adjust output to a new level of prices. Another reason for price stickiness is that changes in prices can be costly to make. This reason makes sense if we interpret curves in the graph above as an aggregate supply and aggregate demand curves. Price changes irritate customers and reprinting price lists may be expensive.
The adjustment process yields more intriguing results if it depends not just on the pressure from the output gap, but also on past price movements. If a firm has seen the price of its products rising by 10% each period, it may expect prices to rise 10% in the next period and may base its pricing decisions not only on the output gap but also on this expected rate of inflation. We will call this additional force the expected rate of inflation, and for simplicity assume that it is equal to last period's rate of price change. The impact of this expected inflation will depend on how much people carry forward past inflation when setting future prices. If people expect inflation to be 10%, they may carry forward all of expected price change and mark up prices by the full 10%, or they may carry forward only part of it, or maybe none of it.
|
|
||
|
|
|
|
|
|
|
|
|
|
|
|
|
|
|
|
|
|
|
|
|
|
|
|
|
|
|
|
|
|
|
|
|
|
|
|
|
|
|
|
|
|
|
|
|
|
|
|
|
|
|
|
|
|
|
|
|
Columns generated as in the previous table
except price level now is: |
||
In the table above, the current price depends on old price, on output gap with price stickiness, and on expected rate of inflation with the carry-forward factor. Adding effects from expected inflation gives the adjustment process a momentum that makes it overshoot equilibrium and results in a cycle. With extreme values, we can have the model completely unstable, so it will crash to zero or shoot off to infinity.
We have shown that simple models can generate cyclical adjustment processes. The keys are that some parts of the system stick, and that the past influences the future with a lag. If real-world economies adjust in similar ways, and it is not far-fetched to assume that they do, we may sometimes see cycles. Do not believe that cycles are forever buried in the graveyard of economic ideas.
Copyright Robert Schenk