Efficiency of an Excise Tax (I)
Politicians may not be fascinated with the efficiency effects of taxes, but economists are. This section looks at how one can examine the efficiency implications of a simple tax, the excise tax.
An excise tax is a sales tax on a specific item. An excise tax can be a per unit tax or an ad valorem tax. The first is a fixed amount of tax per item, whereas the second is a percentage of the value of the item. Excise taxes are a relatively minor source of revenue for most governments, but they can be examined with simple diagrams and they illustrate problems that all taxes have.
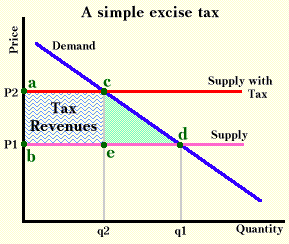
The picture below shows supply and demand diagrams for a competitive market with constant marginal costs. With constant marginal costs, the supply curve will be a horizontal line. Before any tax is imposed, q1 is the quantity sold and P1 is the price. A per unit excise tax imposes a wedge between the price that the sellers see and the price that the buyers see. In the graph the existence of this wedge is indicated by shifting up the supply curve to "Supply with Tax." The "Supply" line shows how sellers react to the prices they see, and the "Supply-with-Tax" line shows how the sellers react to the prices that the buyers see.1

As a result of the tax, the equilibrium quantity is q2. Buyers pay a price of P2, but sellers receive only a price of P1. The amount of revenue that the government collects is the tax (P2-P1) times q2, or the wavy rectangle.
This figure illustrates two important results. First, consumers totally bear this particular tax because the price rises by the full amount of the tax. This is true whether buyers or sellers actually write the check that is sent to the government. If the sellers are legally responsible for paying the check, the tax is totally shifted. This extreme result occurs because of the peculiar way in which the supply curve is drawn--it is not a general result of excise taxes.
Second, the tax causes a welfare loss or economic inefficiency because it prevents some exchanges that could benefit both buyers and sellers. There are several ways to show this cost. One is to use the concept of consumers' surplus. The loss of value to consumers is the loss of consumers' surplus, the area a-c-d-b. The tax revenue, or area a-c-b-e, represents that part of lost value government captures. The triangle c-d-e is a loss to the consumers but it is not a gain to anyone else.
Another way of indicating that there is a welfare loss is to ask what happens to consumers' costs and benefits if another unit beyond q2 in the graph above is produced. The extra value of another unit is the distance from the demand curve to the horizontal axis. The extra cost in terms of the value of resources that must be used is the distance from the "supply" curve to the horizontal axis. Because this latter distance is less than the former, consumers as a whole would benefit by greater production of the taxed item. But this will not happen because the perceived marginal costs--which include the tax--are greater than the actual marginal costs that include only the value of resources.
The efficiency loss of an excise tax can also be illustrated in terms of a production-possibilities frontier.
1Alternatively, the demand curve could be moved downward by the amount of the tax. With this interpretation, the prices along the axis would represent the price excluding the tax. The original demand curve would remain the line showing how buyers react to the price including the tax, and the new demand curve would indicate how buyers would react to the price ignoring the tax. The supply curve would show how sellers react to price excluding the tax, and the intersection of the supply and demand curves would show the equilibrium price excluding tax.
Copyright Robert Schenk